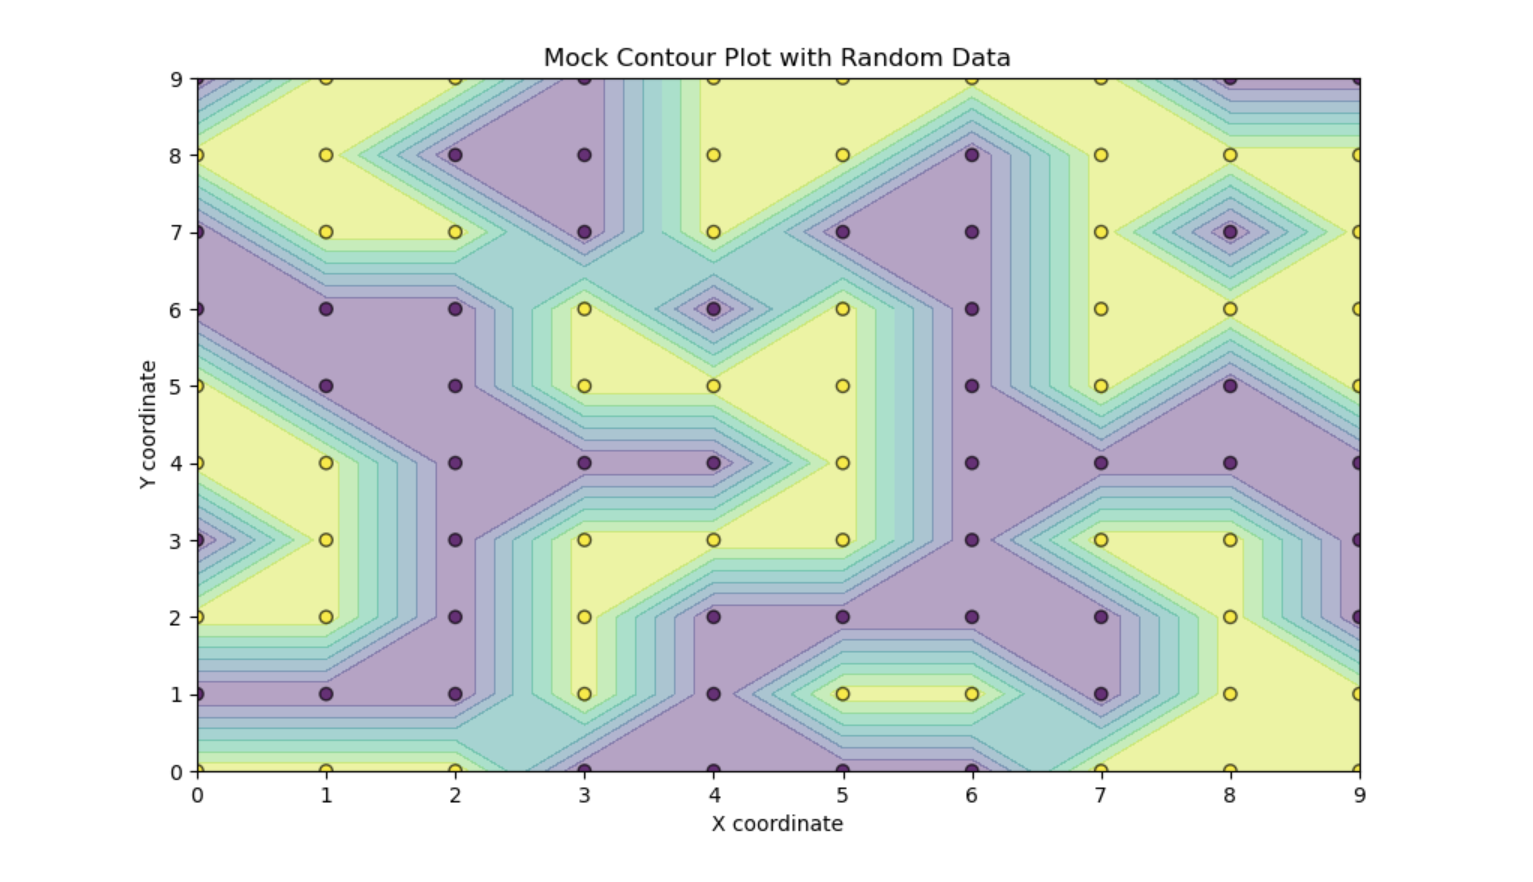
加上可视化
import numpy as np
from matplotlib import pyplot as plt

# 设置 x 和 y 坐标的最小值和最大值
x_min, x_max = 0, 10
y_min, y_max = 0, 10

# np.meshgrid 函数用于生成一个坐标网格
# np.arange 创建一个等差数组,这里用于生成 x 和 y 轴上的点
xx, yy = np.meshgrid(np.arange(x_min, x_max, 1),  # x 轴上的点
                     np.arange(y_min, y_max, 1))  # y 轴上的点

# 打印生成的 x 坐标网格
print(xx)
# 打印生成的 y 坐标网格
print(yy)

def mock_predict(X):
    # X 是输入数据,假设每一行是一个数据点
    n_samples = X.shape[0]
    # 随机生成 0 或 1 的类别标签
    random_predictions = np.random.randint(0, 2, size=n_samples)
    return random_predictions

# 使用 mock_predict 函数来模拟预测
Z = mock_predict(np.c_[xx.ravel(), yy.ravel()])
Z = Z.reshape(xx.shape)

print(Z)

# 绘制等高线图
plt.figure(figsize=(10, 6))
plt.contourf(xx, yy, Z, alpha=0.4)

# 绘制原始的网格点
# 点的颜色按类别 (0 或 1) 区分
plt.scatter(xx.ravel(), yy.ravel(), c=Z.ravel(), edgecolor='k', alpha=0.7)


# 添加图表标题和轴标签
plt.title('Mock Contour Plot with Random Data')
plt.xlabel('X coordinate')
plt.ylabel('Y coordinate')

# 显示图形
plt.show()
