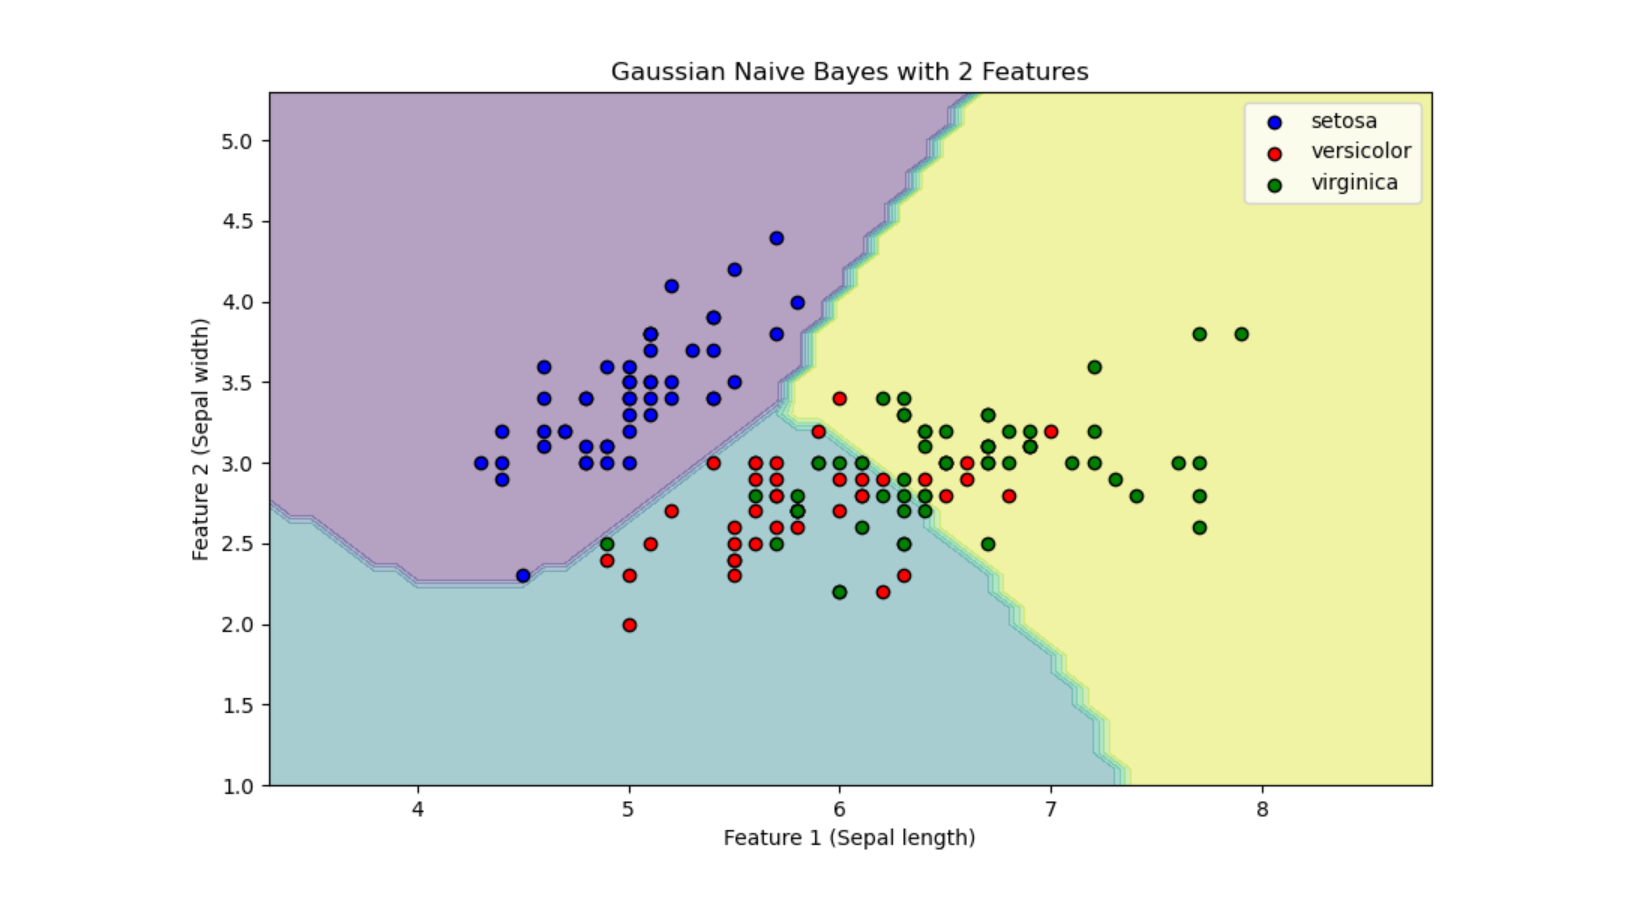
这段代码使用鸢尾花数据集(Iris dataset)来训练一个高斯朴素贝叶斯分类器,并对结果进行可视化。
它首先加载鸢尾花数据集,但只考虑前两个特征(萼片长度和宽度)。然后,数据集被分为训练集和测试集。使用训练集,代码训练了一个高斯朴素贝叶斯模型。接着,代码创建了一个坐标网格,用于绘制决策边界,并使用模型预测这些网格点的类别。最后,它以等高线图的形式显示了模型的决策区域,并在图上用不同颜色的点标出了原始数据集中的样本,每种颜色代表一种鸢尾花类别。通过这种方式,可视化展示了模型如何根据两个特征将数据划分为不同的类别。
import numpy as np
import matplotlib.pyplot as plt
from sklearn import datasets
from sklearn.model_selection import train_test_split
from sklearn.naive_bayes import GaussianNB

# 加载鸢尾花数据集,并仅选择前两个特征
iris = datasets.load_iris()
X = iris.data[:, :2]  # 只取前两个特征
y = iris.target

# 数据集划分为训练集和测试集
X_train, X_test, y_train, y_test = train_test_split(X, y, test_size=0.3, random_state=0)

# 训练高斯朴素贝叶斯模型
gnb = GaussianNB()
gnb.fit(X_train, y_train)

# 创建网格,用于绘制等高线
x_min, x_max = X[:, 0].min() - 1, X[:, 0].max() + 1
y_min, y_max = X[:, 1].min() - 1, X[:, 1].max() + 1
xx, yy = np.meshgrid(np.arange(x_min, x_max, 0.1), # 生成一个坐标矩阵网格
                     np.arange(y_min, y_max, 0.1))

# 预测网格上的每个点的类别
Z = gnb.predict(np.c_[xx.ravel(), yy.ravel()])
Z = Z.reshape(xx.shape)

# 绘制等高线和数据点
plt.figure(figsize=(10, 6))
plt.contourf(xx, yy, Z, alpha=0.4)
colors = ['blue', 'red', 'green']
for color, i, target_name in zip(colors, [0, 1, 2], iris.target_names):
    plt.scatter(X[y == i, 0], X[y == i, 1], color=color, label=target_name, edgecolor='k')

plt.title('Gaussian Naive Bayes with 2 Features')
plt.xlabel('Feature 1 (Sepal length)')
plt.ylabel('Feature 2 (Sepal width)')
plt.legend()
plt.show()
